Monday, August 25, 2008

Wk 33 summary

=> 7 workouts (I was able to go running very early on Friday before a big Typhoon struck Hong Kong ..)
=> 119 Km
=> 3 hard workouts:
  • Wednesday: 6x2km @ MP , all around 7'25"-7'30", HR below 170bpm. Not yet in the target pace of 3'40"/km, but is still 2 months to go (and it was 27C). Including w/u and c/d, total was a decent 25km...
  • Friday: 5x1k @10k pace + hill charges. It was right before a typhoon, so the air was cooler, but a lot of wind. I was able to find a sheltered stretch and did very decent 1k interval in 3'17"-3'20" feeling really good (1'30" recovery jog)
  • Sunday: long run. A total write-off. 27km @4'25" pace, but they felt like 52km... I had back pain, extreme sense of fatigue, legs like stones, lack of sleep ... really awful set of sensations. After 20k I felt like after a marathon... and the worse of it is that my HR was rock bottom, only 140bpm average (only 70%HRmax), with many miles at 135. That is really unusual and sign of poor recovery and fatigue. I will take 2 days very easy and sleep more..
  • Saturday was not really a hard workout, but it was pleasant to run with Stefano and make some strides on the track. I tested for the first time my spikes Mizuno LD and they felt great. We run series of 100m and 200m and got always beaten... I can predict that Stefano, given his talent, committment and smart training, is really on a rising curve and will be the man to beat in Hong Kong for the season.

Sunday, August 24, 2008

Tribute


My personal tribute to Samuel Wanjiru and his great race. It was a fantastic marathon to watch.
He is a very humble guy and it is amazing how well he can speak Japanese (he actually married a Japanese woman..).
Top picture: Deriba Merga, Samuel Wanjiry, Atsushi Sato (Fukuoka Marathon podium)
Bottom: let's hope that he transfered some running skill through this handshake...

I will not complain anymore about the humidity and heat in China affecting running performance... 2h06' ...
Posted by Picasa

Monday, August 18, 2008

Wk 32 Summary

  • 7 workouts (included 1 race)
  • 114 km
  • 3 quality workouts:
  • Tuesday: 21km with 6k @ LT in 3'30". Felt very comfortable at that pace. The HR hit the actual LT level (177bpm for me) only at the end. At the end, some strides. Felt very confident for Sunday's race
  • Thursday: 30k long run with some stretches @MP. A bit fatigued, too little sleep in these days and is really hot out there. But the workout went out quite smoothly, 30k passed quite quickly
  • Sunday: 10k race in 34'57" + w/u and c/d total 20k (detailed report already posted). Looking at the race as competitive event, I should be rather happy. As fitness test, not really satisfactory, felt like crap after 7k and miss completely my target time.

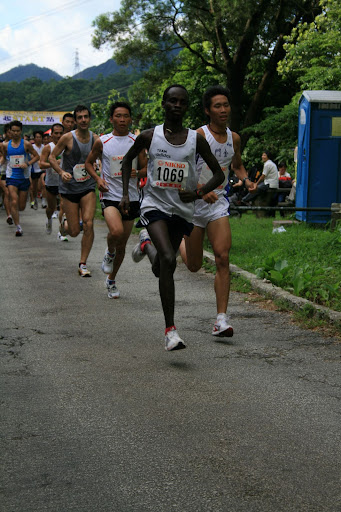
A Kenian among us


I signed up for another summer 10k race yesterday and I was a bit puzzled to see collecting his bib also the lean frame of a Kenian runner...
a "real" Kenian in a race in HK is incredible... actually he was a Kenian living and running in Malaysia who was on some short holiday in Hong Kong.
Together with him, the race line-up also included 2 invited runners from Taiwan.
In short, not many hopes to cut the ribbon today...
With 28C/90% Rh at the start, I did hope to make a good race and set a time around 34'30"/34'40". In the past 2 weeks I felt the pace of 3'25"/km quite affordable.

But in reality, I did not make the counts with the lingering fatigue from the heavy workload training for the marathon. I started well, making a good pace that lined up very quickly all the local competitors (the overseas runner were soon gone, disappeared ahead with a different speed).
It was particularly pleasant that the only one who kept pace was my occasional running partner E. (see many older posts). Sharing those heavy workouts was really beneficial for me and did really brought him a great improvement.
We made the 5k in 17'20" and I was feeling relatevely fresh, ready to push a bit more...
but..
...but simply I felt out of gas, not really ready to make any increase of speed. At 5k mark, we were even able to catch one of thew taiwanese invited runner, but he easily resisted at my attack and shook me off again.
So I just cruised to the line in 34'57", just ahead of a slight margin to E.

Good: 1st Master and 1st "local" runner. It was pleasant to see that many components of the HK National Team were left behind. 2 Vouchers for Mizuno shoes are not to neglect anyway...
Bad: hei, I really expected to go faster. No actual improvement in time versus last month's race on the same course. Maybe was a bit hotter and sun was shining, but at 7k I switched off the engines, not really a good sign. I need to understand if the fatigue is due to normal training adaptation or I am overdoing (considering the heat and difficult recovery).

race summary: 28C/90% Rh. 850 finishers. 4th overall (1st Master). 34'57" (17"23"+17"34", but the first 5k I felt like jogging, the other 5k like the end of a marathon..).
For the record, the Kenian was likely to be in a "off" day and collapsed in the 2nd half, with the taiwanese runner marking a good 32'10" to win the race
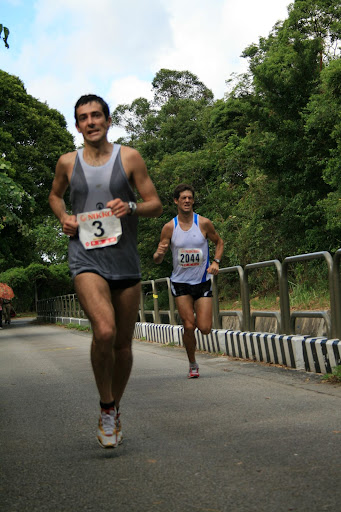
(Pics: above, start with the final finishing order already sealed after 50metres... below, struggling somewhere around 8k with E. at my chase (unfruitful).)

Friday, August 15, 2008

more on Cadence

Thanks to all those who contributed with their comments. It might be worthy to elaborate more with a new post rather than reply on the comments section.
It is really a interesting topic for me, because I have never seen any really good publication on the matter.
Basically running output is a result of this mechanical principle "Stroke length x revolutions" (stride length times cadence), so it would be very interesting to make studies on the optimal stroke and revolution based on the lenght of the legs of the runner, his speed, etc. Eventually, it should be possible to get charts like those torque/rpm/displacement available for cars...

to Mike:
yes, totally agree that the sensation of reducing the contact time on the ground is like having "stiff legs". Now I feel (especially in those faster workout), that my legs are like stiff levers rotating under the fulcrum of the hips.

to Alien Runner:
In my personal opinion, it is important to evaluate the starting point: what is your current cadence at different speed?
If your current level is still far from the recommended (88-92 depending on the speed), then it might be worthy to work more on improving the cadence. If your stride is already quick enough, than maybe it is time to pass on to improve the stride length.
Obviously we can expect that improving the overall fitness would bring benefit on the 2 directions (stride length and cadence), but working specifically on the personal weakness can give the best return...
If I take myself (as example):

Boston Marathon 2007 - time 2h42'09" => average cadence 85 / average stride 153cm
Fukuoka Marathon (December 2007)- time 2h38'26" => average cadence 86 / average stride lenght 155cm

So the improvement was due both to a quicker and a longer stride. Now, in my quest for running 2h35', I can calculate what I would need.
- Running at the current cadence (86), the stride should lengthen to 158cm
- Keeping the current stride lenght (155), I should spin at 88rpm (difficult...)
=> I guess that the most likely target is to reach 87rpm, increasing the stride to 157cm

Also amusing is calculating what could be my maximum speed if I could reach the theoretical optimal cadence (90rpm) at the current stride length ==> 2h31'
And dipping under 2h30' would only be possible if my stride can reach the 160cm...

to Simone:
in the PPT 5, there is a function "Reports" where you can monitor the trend of several data. You can choose which data to display and the date range, etc, etc. Unfortunately the PPT SW has some limitations in how the data are displayed and you can not draw average or trends.
So I usually prefer to extraxt the data to Excel and manipulate the data.
How to do: once the report is displayed, you can use the function Edit / Copy to clipboard to extract the data. Than I paste them to an Excel spreadsheet. I usually purge the data from all the workouts where I was not wearing the S3 sensor, to avoid the the presence of "0" would affect the real trend. In this way, I can see the trend of data over time and create moving averages to see the real trend.
I find useful: weekly mileage, Running index, cadence, Exertion

About your marathon, I have doubts that your stride lenght could have dropped so low at 130cm. Unless your pace dropped dramatically, the stride can not have dropped that much.

As a reference, I post the data of my Fukuoka Marathon (which was almost 99% perfect as execution). As you can see, the stride fluctuated only by few cm

Distance
Time
Split
Average Cadence


Stride (cm)


5k
0.18.34
0.18.34
87

153


10k
0.37.15
0.18.41
86

153


15k
0.56.00
0.18.45
85

154


20k
1.14.44
0.18.44
85

155


25k
1.33.38
0.18.54
85

154


30k
1.52.34
0.18.56
85

154


35k
2.11.26
0.18.52
86

155


40k
2.30.08
0.18.42
86

156


42.2k
2.38.24
0.08.16
86

154


Thursday, August 14, 2008

Cadence chart


I dig out more data from the Polar SW and here another chart. This is the average cadence of each workout from end 2006 to now.

It shows an increase from the 80/81 to the 84 of today.

From all I read, there is a significant agreement that increasing the turnover is the best way to increase speed: less load on the joints at each step and less "deceleration" caused by the impact of the feet on the ground.
Actually since many months I tried to run my easy runs with small steps, like running in eggs.
I noticed now that when I have my Marathon Pace runs, I keep around 89/90rpm, while in the past I was more around 86/87.

Wednesday, August 13, 2008

Running Index / Stride Lenght charts @13August

for the "Polar" maniacs...

I extracted these 2 sets of data from the Polar SW and might deserve some remarks..

a) Running Index (the red line is the rolling average of 20 points)
I already showed this chart some months ago with an explanation.
Polar website explanation on the Index here

After 3 solid months of conditioning, the chart is going in the right direction. It is remarkable that I am getting very close to the same levels as my peak form last season, and it is still summer.

Definitely this function of the Polar SW is worthy to keep under watch every month or so to understand the actual trend of the form. There is a quite close correlation between the trend of the Running Index and the actual performances in races.


(Note for Polar PPT users: use the function "report" and later "edit/copy to clipboard". You paste the data to Excel and create this chart)


b) Stride Length Average


This chart leave me rather puzzled...
It seems that in my peak form, the stride got the longest (it makes sense), but I am really perplexed about why it is now declining so considerably in the part 2-3 months, regardless of the remarkable increase of fitness (as shown by the RI above)...
Might be "too much" base training, not enough speedwork, with loss of strength in the legs? I really invite for comments from the readers...